A Guide to Understanding and Mastering Technical Analysis
*OspreyFX would like to state that traders should research extensively before following any information given hereby. Any assumptions made in this article are provided solely for entertainment purposes and not for traders to guide or alter their positions. Please read our Terms & Conditions and Risk Disclosure for more information.
A Guide to Identifying Patterns and Mastering Technical Analysis
Some traders and investors swear by technical analysis. They make their investment decisions based solely on the analysis of a given asset’s price history. Technical analysis, which was introduced to the trading world by Charles Dow in the 1800s, can also be referred to as chart reading or good old-fashioned tape reading.
Forex Technical Analysis
Technical analysis in Forex requires the trader to review patterns in a pair’s price history. The interpretation of the chart will help them recognize the different models of price behavior. So, based on the idea of history repeating itself, the trader will look for these same patterns in the current market. Thus, ascertaining the best time to enter and exit a trade.
In other words, anticipating that the pattern maintains its validity and stays in the technical model, the trader decides to buy or sell an asset.
How Technical Analysis Works
Technical traders and investors use price action and related data to decide when to buy or sell. These methods can be as interpretive as chart patterns or as specific as mathematical formulas.
Technicians, often called chartists, assume that assets create chart formations, the development of these formations can be foreseen with precision. Therefore, an investment decision can be made by reading the chart and acting upon it. In short, the expectation of reaping profits when the model unfolds.
Technical analysis suggests that the markets are not random and that behind every movement there is a reason.
Can Market Behavior be Predicted?
According to technicians, regardless of the asset class, i.e., stocks, indexes, currencies, or commodities, the market behaves in a way that can be understood and predicted.
As one of the praised tape readers and a household name in technical analysis, Jesse Livermore says, “markets are never wrong, opinions often are.”
The Importance of Patterns in Technical Analysis
Technical analysis relies on the formation of price patterns, perhaps the most famous being the head and shoulders and double top.
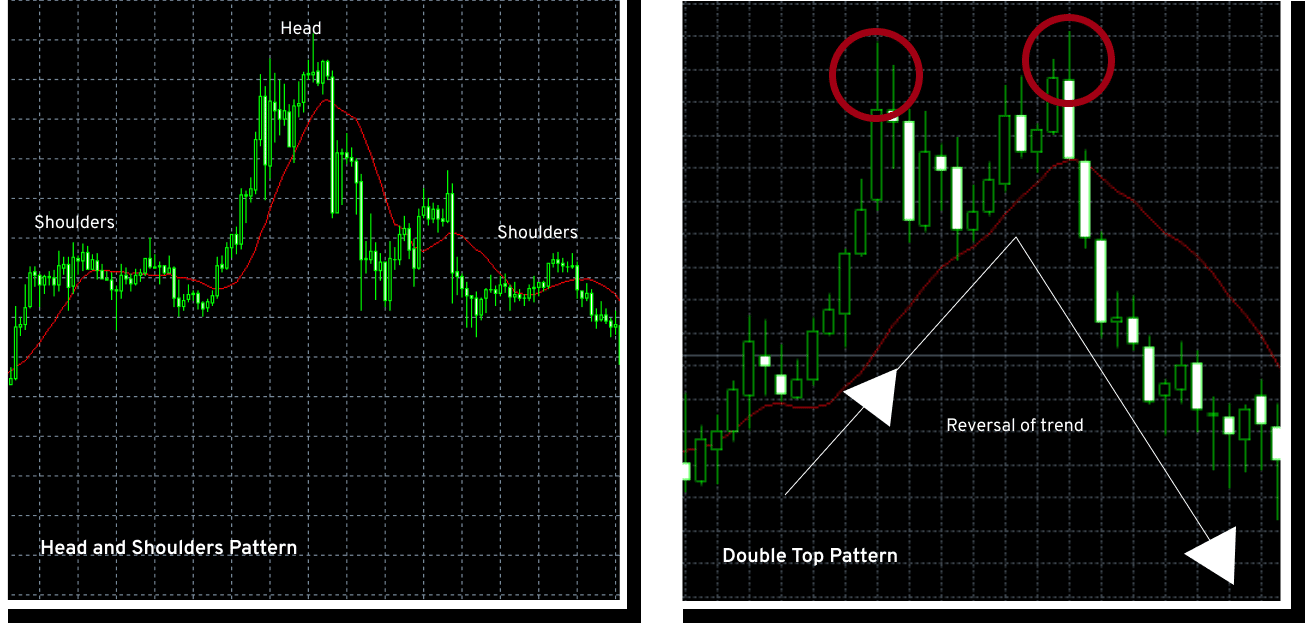
The patterns highlight specific price behavior with their inflection points. For example, where and when the trend will turn or whether the trend will continue in the same direction.
All price models have their respective environments. These patterns can form in a volatile market, while others in a calm market. Through technical analysis, patterns help point to the asset’s development, either in a bullish or a bearish scenario.
Other popular price patterns include:
- Double bottom
- Cup and handle
- Rounding bottom
- Wedges
- Pennants
- Ascending and descending triangles
- Symmetrical triangles
Popular Indicators for Technical Analysis
Moving Average Convergence/Divergence line (MACD)
The moving averages help signal trends and momentum. The MACD lines enable the trader to analyze an asset’s price trend. Thus, establishing its movement, strength, and direction.
Bollinger Bands
In the early 1980s, John Bollinger developed the now-famous trading analysis tool. Bollinger Bands work to indicate the volatility of the market in a given period. The top and bottom bands identify the price, and the middle band represents the moving average. Moreover, the stock price moves between the upper and lower bands, and depending on the level of volatility, the lines will widen or reduce.
Relative Strength Index (RSI)
The relative strength index is an indicator widely used for technical analysis and will help the trader identify buy and sell signals. Furthermore, the momentum oscillator enables the trader to analyze the price history of an asset. The RSI oscillates between 0 – 100, and a value above 70 indicates that the asset is being overvalued or becoming overbought. On the other hand, a reading under 30 indicates the opposite. Thus, the asset is undervalued or oversold.
How Many Trading Indicators are too Many?
Indicators used for technical analysis can help designate market patterns and signal the right time to buy and sell. Nevertheless, beware of using too many at one time. Simply because there’s an overwhelming amount of indicators available to you, doesn’t mean that you should use them all. Numerous signals can lead to confusion. If you aren’t sure about which ones to use, why not test out your strategies on a demo account first. It’s a risk-free way to practice technical analysis before using your live account.
Successful traders are able to identify opportunities with approximately four trading indicators. Furthermore, they indicate the chart patterns, momentum, support and resistance levels, and price trends.
Do you need to be an Experienced Trader to use a Technical Trading Strategy?
No crystal ball can help you predict future price patterns. To master technical analysis, you need to understand the asset’s price history to anticipate its future movement. Based on these predictions, you must identify the right time to enter and exit the trade.
A technical trader must learn how to distinguish between different price models. Furthermore, the inability to recognize the patterns or using the wrong one could cost you your investment! Not to mention the missed opportunities to profit.
Even if the trader is experienced and knowledgeable, relying solely on technical models as indicators of a price direction is risky. Chart patterns cannot guarantee with 100% certainty that the price will develop as expected by the model.
Still, technical analysis, as hedge fund manager Paul Tudor Jones says, “has become something of a lost art form that requires traders to close their eyes and trust the price action”. So, if you have decided to pursue a future in trading the markets, technical analysis is worth considering.
Technical Analysis and Fundamental Analysis
Technical analysts will review the asset’s price history in order to identify patterns. And while this can give you an edge, most traders will incorporate Fundamental Analysis and use them in tandem. Fundamental analysis examines the economic and financial data of a company to determine its impact on a given asset. Traders use these strategies together to help forecast market trends.
Final Takeaway
If you want to become an expert at technical analysis, you’ll need to devote time to studying the chart patterns. A strong understanding of the financial market, an analytical mind, and a keen eye will help identify trading those opportunities.
If you are a firm believer that history repeats itself, then technical analysis is a great way to improve your trading game. Try it out with us now!
Sign up with OspreyFX today!