EUR/USD Weekly strategy talking points:
- Long and Short Term view on the EUR/USD pair.
- Elliot wave analysis and strategy to follow.
*OspreyFX would like to state that the views held in this article are solely held by the trader interviewed and traders should research extensively before following the advice given hereby.
Please read our Risk Disclosure for more information.
Elliott wave analysis and weekly strategy for EUR/USD, by Stefan Rados
Stefan Rados is a professional trader with extensive experience in the Forex markets. He was awarded the 1st Prize of OspreyFX Live Trading Competition, earning a stunning $50,000 for his performance.
The OspreyFX team sat down with Stefan to get his insight on what this week may hold for the EUR/USD pair. The following article shows a deep analysis of the charts using the Elliot wave principle and what Stefan considers is the best strategy to follow.
Subscribe to our newsletter to receive our weekly updates + more straight to your inbox!
Monthly chart analysis
This chart shows that the EUR made bottom in the year 2000 on the 0.8236 level, and after that, it showed a powerful upside action to 1.6033 in 2008. This is the first impulsive wave and the blue wave A on the chart.
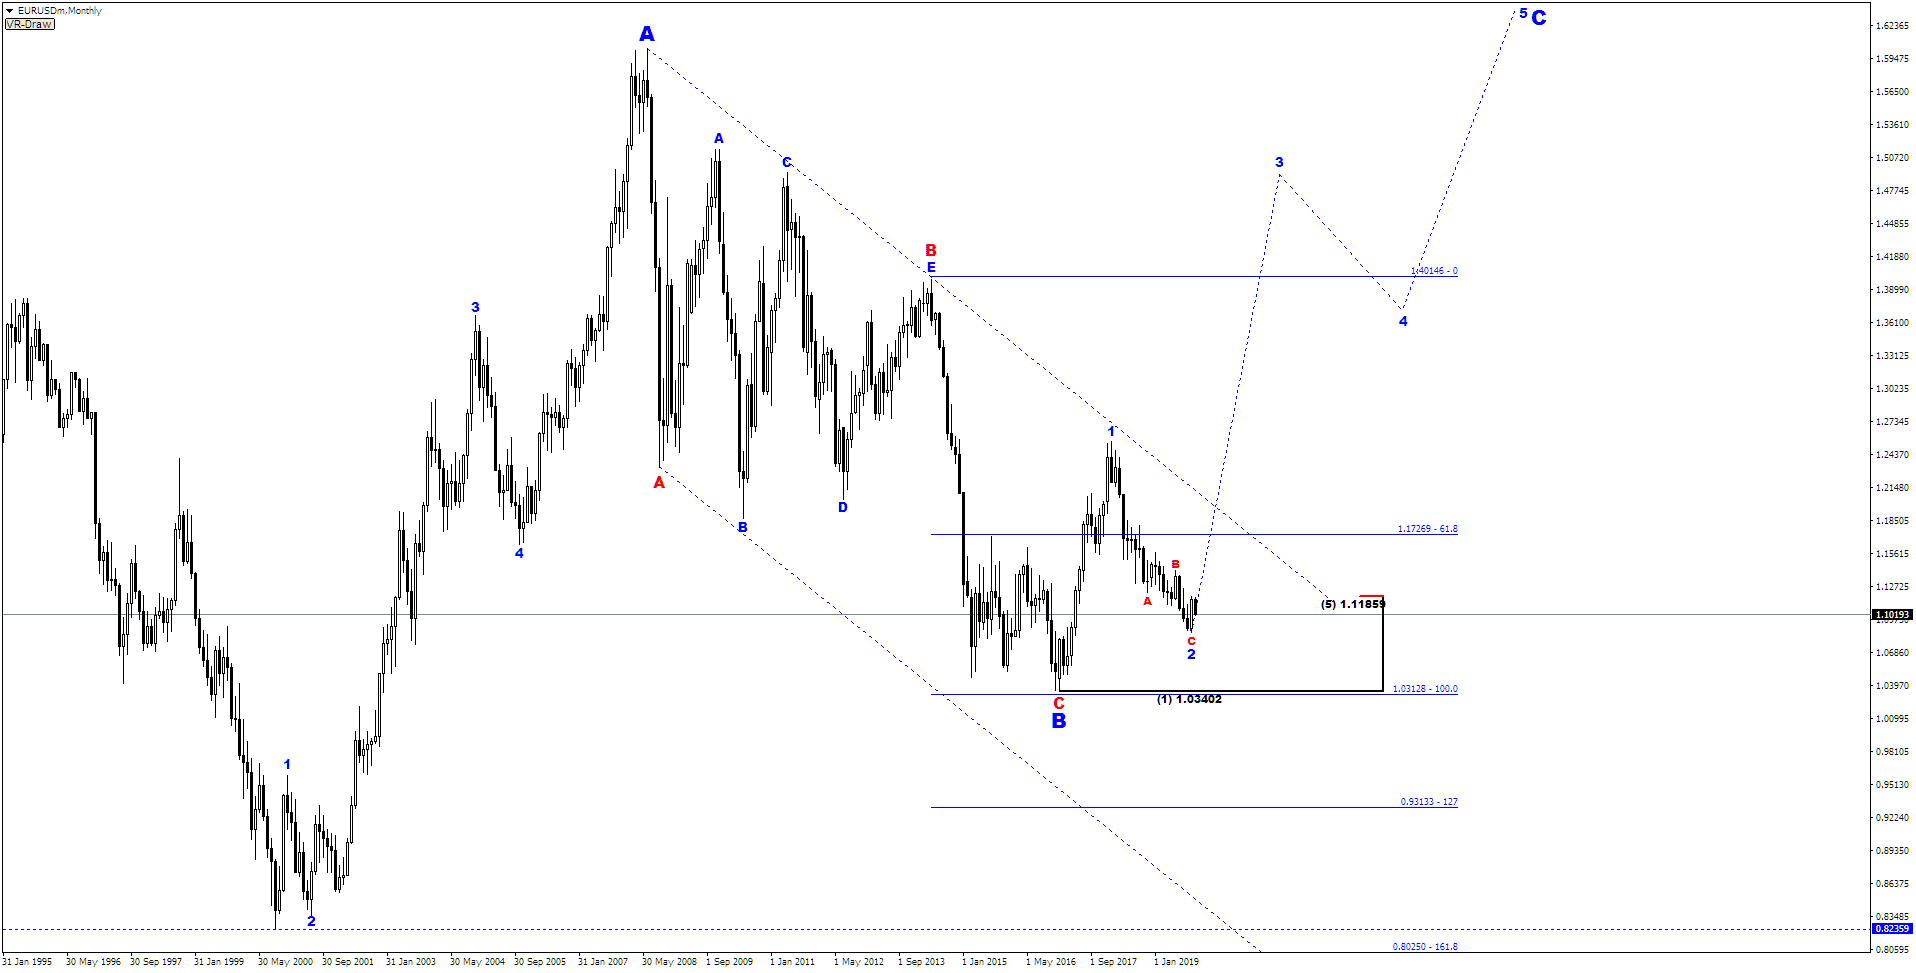
Blue wave B witnessed a downside action at a much slower pace than the upside action from blue wave A. Blue wave B is composed by 3 waves, red waves A B C. Red wave A was impulsive, red wave B had the shape of a triangle and red wave C impulsive as well. Thus, completing blue wave B in a zigzag shape. Suggesting the downside action from the year 2008 is only a correction to blue wave A. With the downside action settling in 2017 on the 1.0340 level.
Furthermore, EUR showed a decent upside action reaching the 1.2555 level. According to Stefan that that could be the beginning of the EUR climb. From 2018 until October 2019 EUR was declining, but again with a much slower pace than it was rising before. Suggesting that it is only a correction on blue wave 1, and it looks completed now again in a zigzag shape on level 1.0878. That means EUR is ready for an upside continuation in wave 3 which could prove very powerful on the upside.
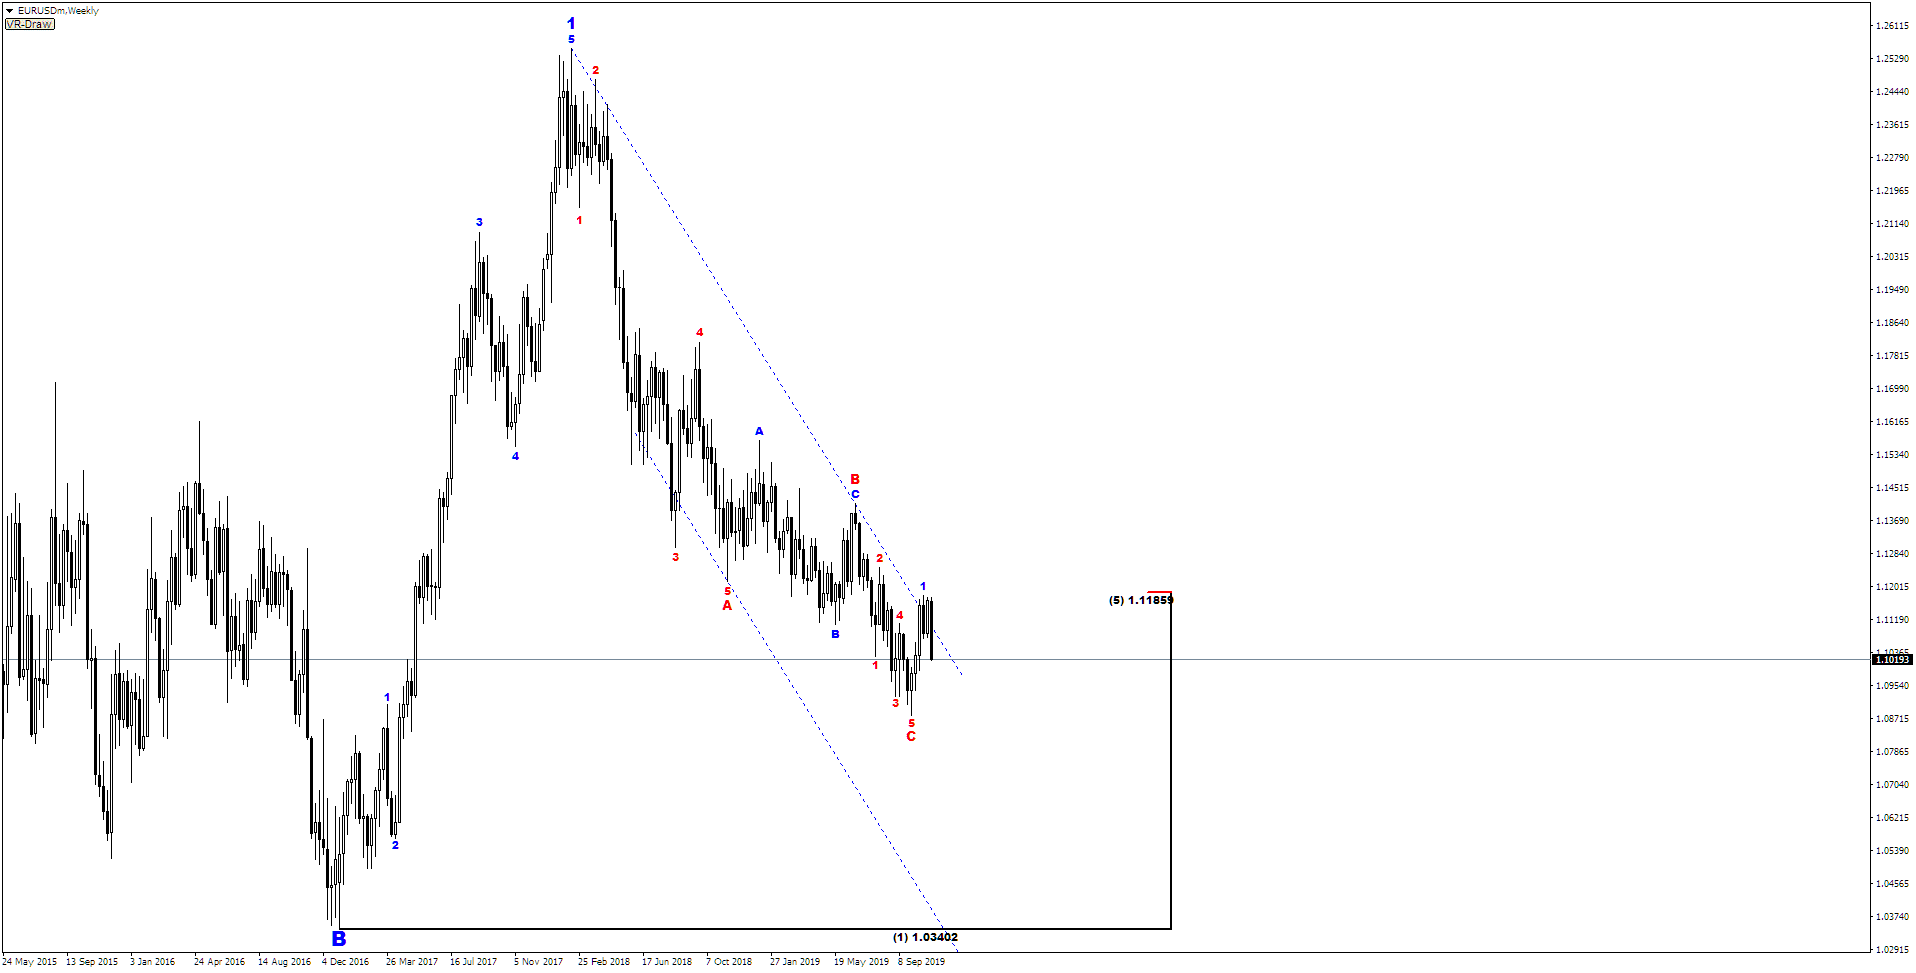
Weekly chart analysis: Closer look to the recent downside action from year 2018
The chart shows 5 waves in red wave A, 3 waves in red wave B, and 5 waves in wave C. Shaping to a diagonal end, something very common for zigzag C waves. Signs of a bullish potential exist as well, breaking the channel towards the upside in blue wave 1 at 1.1179 level. Giving confidence to take a long position on EUR against the 1.0878 level.
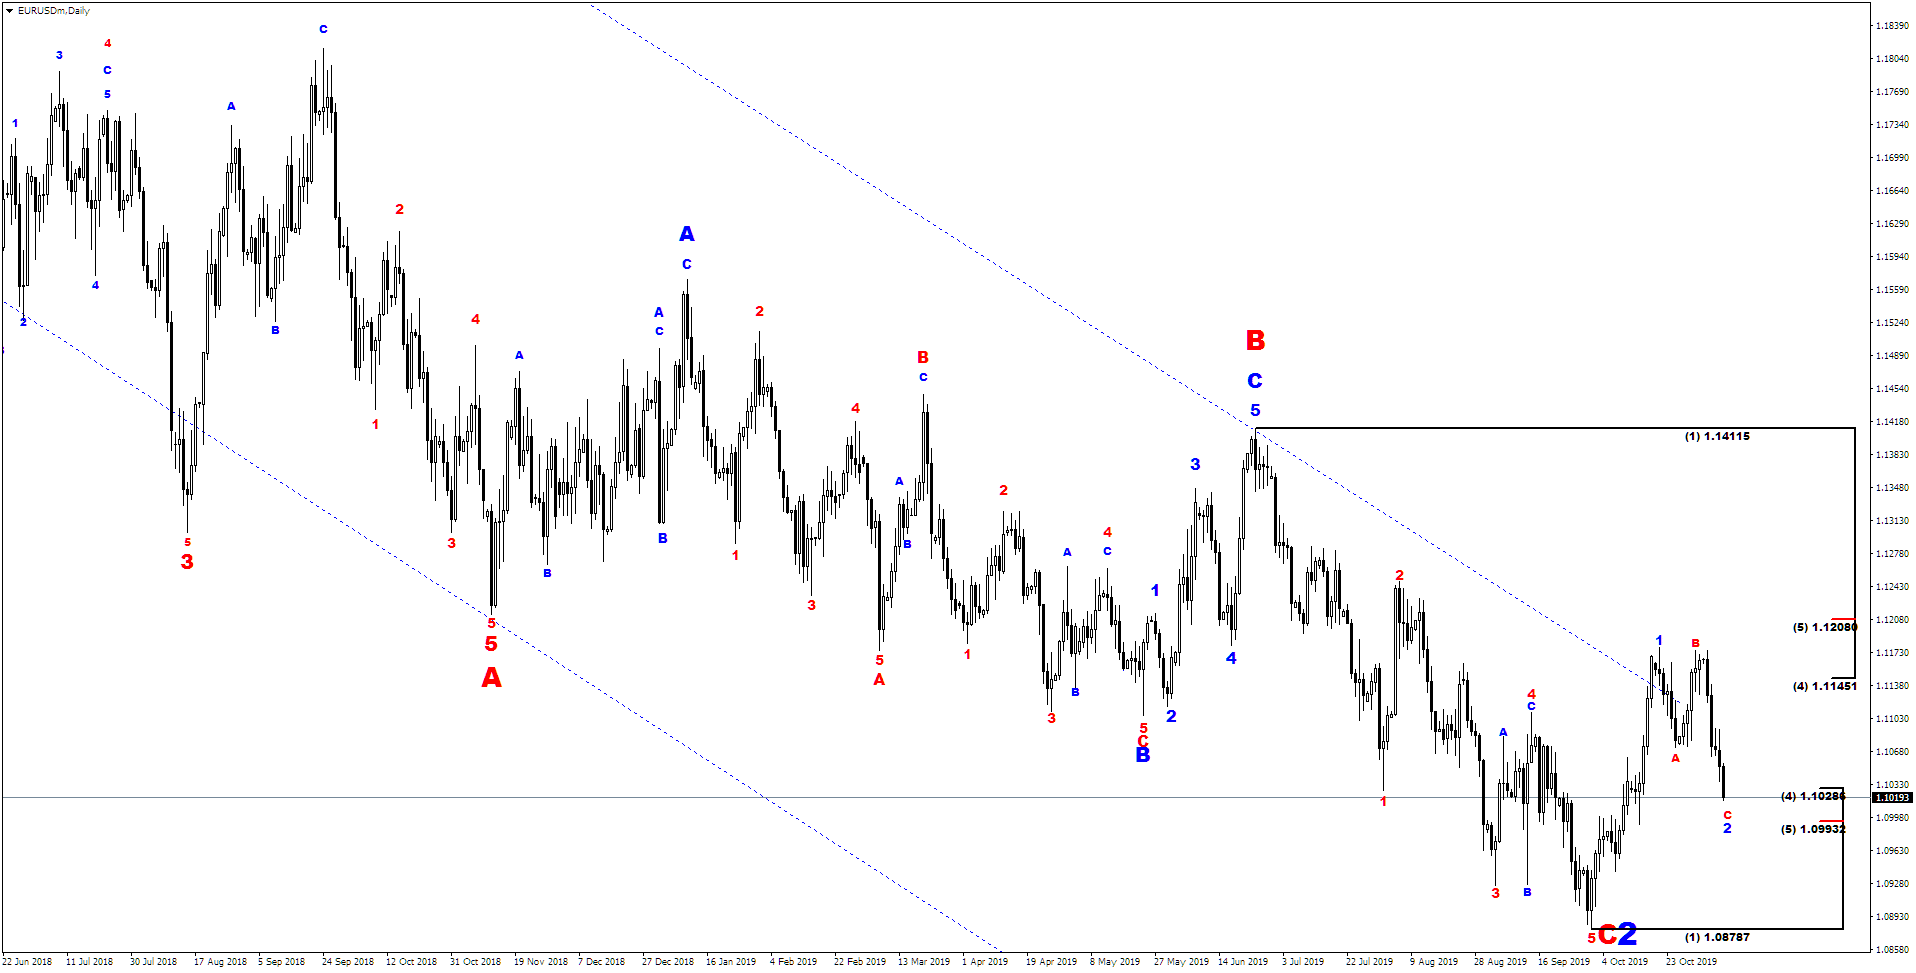
Daily chart: Closer look
Downside action could be completed at any moment. 61.8 Fibonacci support is very close to the 1.0993 level. It could be the final target of a downside action. Seeming like a flat correction in ABC shape in wave 2, where C wave shows an impulsive nature, but it is only part of the correction.
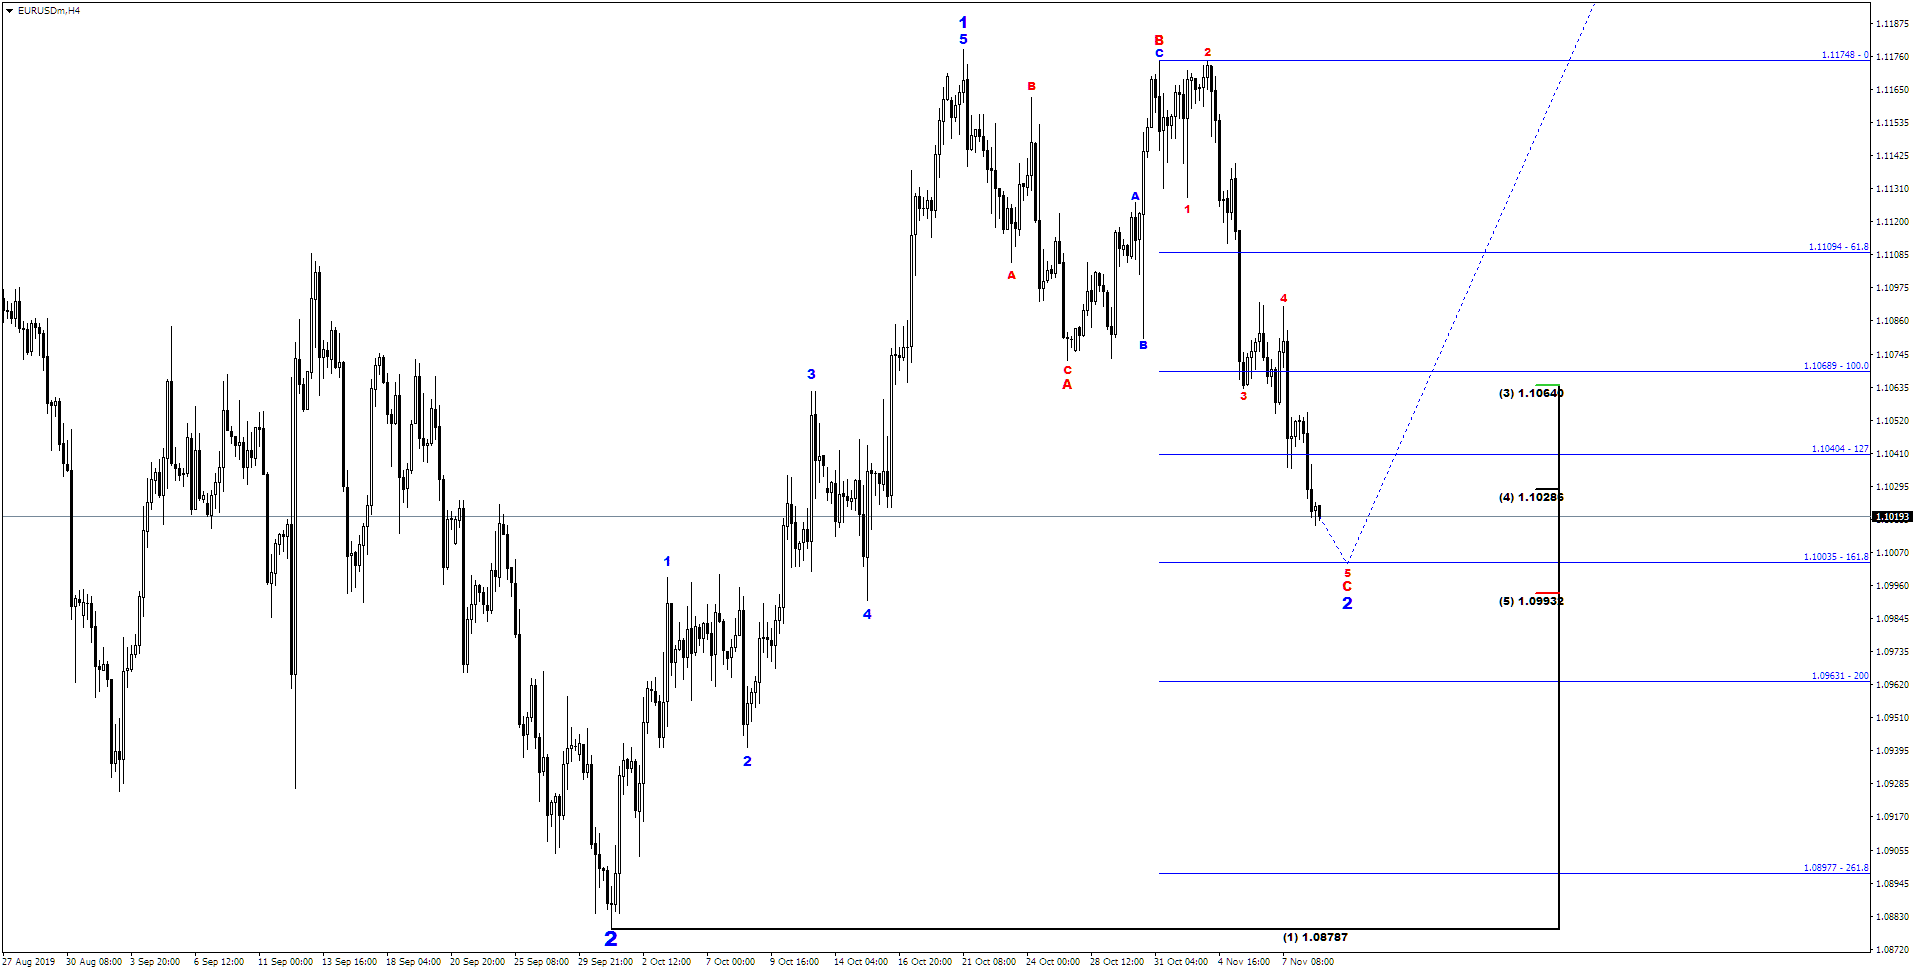
4H Chart: Turning point on the upside
Red C wave of wave 2 shows another target, a 1.618 extension on 1.1003 level. Which could mean a turning point on the upside as shown on the chart.
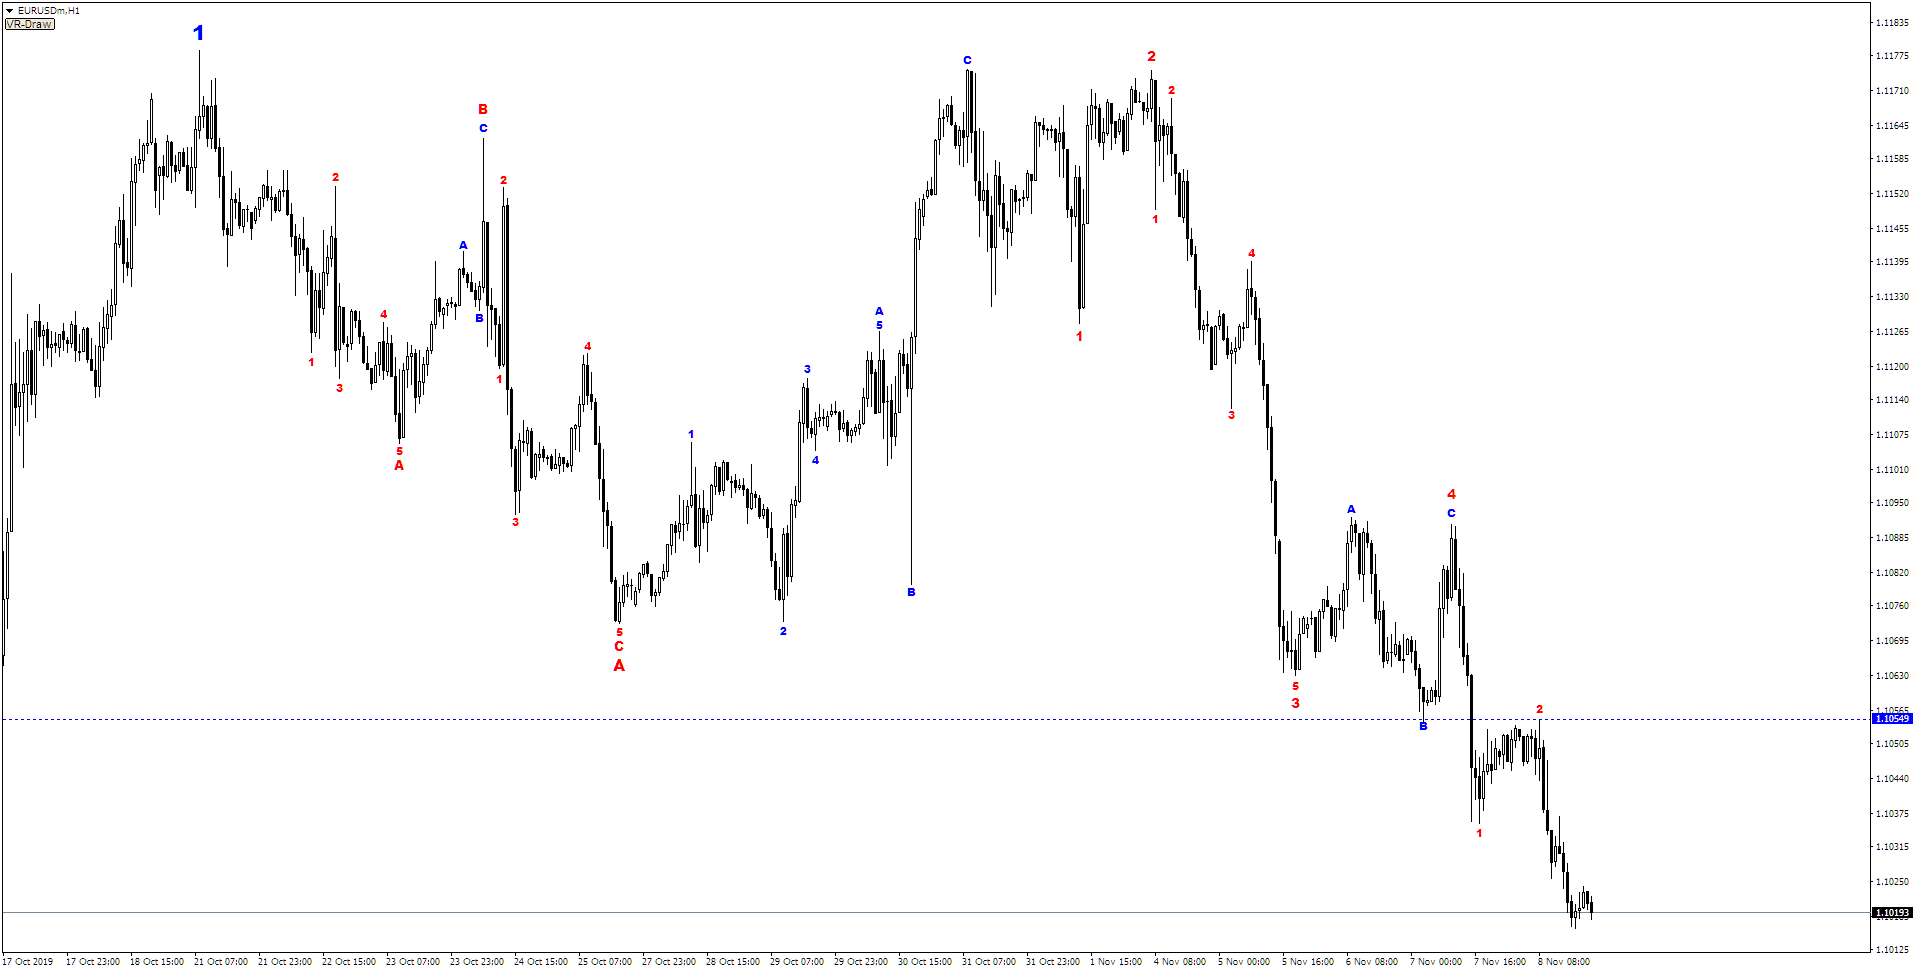
1H chart: More detailed wave count of downside action from 1.1179 level
Red wave A had an ABC structure, red wave B went strong to the upside also with an ABC structure. Finally, the C wave, which is currently happening, could be over at any moment now. It looks like there is still little more room to the downside reaching the 1.0993 – 1.1003 zone. Breaking the 1.1055 level will be the first sign of reaching the bottom of wave C. Completing wave 2, which means that a powerful upside action is starting with first targets in the 1.1235 -1.13 zones.
Direction to take and how to trade the analysis
The goal is to open a long position against 1.0878 lows with the best possible risk/reward ratio.
Long entry in zone 1.0993-1.1003, TP zone = 1.1235-1.13, SL = 1.0878.
Alternatively, there’s window for an entry point if EUR breaks 1.1055 level to upside, long entry zone = 1.1057 – 1.1077, SL=1.0878, TP zone = 1.1235 – 1.130.
This is Stefan’s long and short term view on EUR/USD. Most probable scenario with a good risk/reward ratio.